Since the conditional formatting feature has been introduced in Excel, it’s easy to filter data by certain criteria. But have you ever thought that this function happens to be used to draw … How do you implement conditional formatting?
Step 1: Fill the 1%~100% in a 10×10 area, and turn this area into a set area for conditional formatting, $M$10 is the original completion rate data.

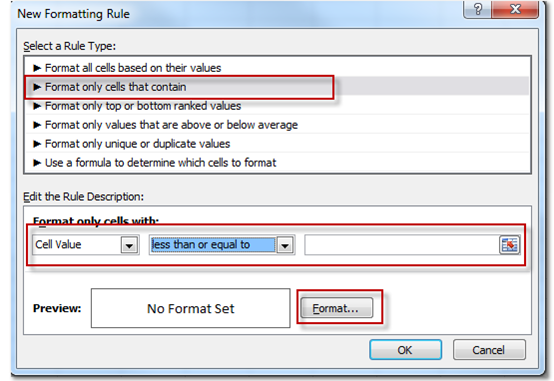
Step 2: Set conditional formatting for the locale in the first stage, select Format only for cells containing the following, and set the condition to less than or equal to =$M$10, and the corresponding format is the cell fill color and the text color.

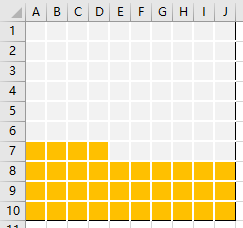
“OK” followed by the following graphic design:

Step 3: Make the necessary landscaping for this 10×10 area, including adding borders, setting the fill color to the same color as the text. The following styles can be further obtained:

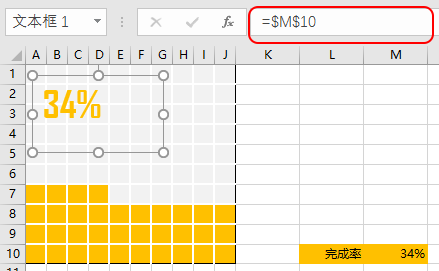
Step 4: Add a text box and enter the formula “= $M$10” In the text box


In the end, you can use

